Solubility
Different amounts of different solutes will dissolve in the same volume of solvent. Different amounts of the same solute will dissolve in the same volume of solvent at different temperatures. We therefore need to have a measure of how much of a substance will dissolve in a given solvent at a given temperature.
We define the solubility of a substance as the number of grams of that substance that will dissolve in 100g of water at a given temperature. To show how this solubility varies with temperature, we plot solubility curves, with the temperature on the x-axis and the solubility (in g per 100g of solvent) on the y-axis.
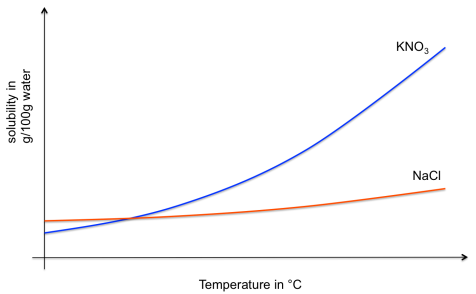
The lines on the solubility curve represent where the solution is saturated. Anywhere below the lines, the solution is not saturated and more solute could be dissolved. Anywhere above the lines, the solution contains more solute than can be dissolved in the solvent at that temperature, so some of it will remain solid (either as undissolved material, or by forming crystals).
